Tables
CSV and TSV are laid out as tables: view the start or the end, hide columns, sort, and draw bars in number columns.
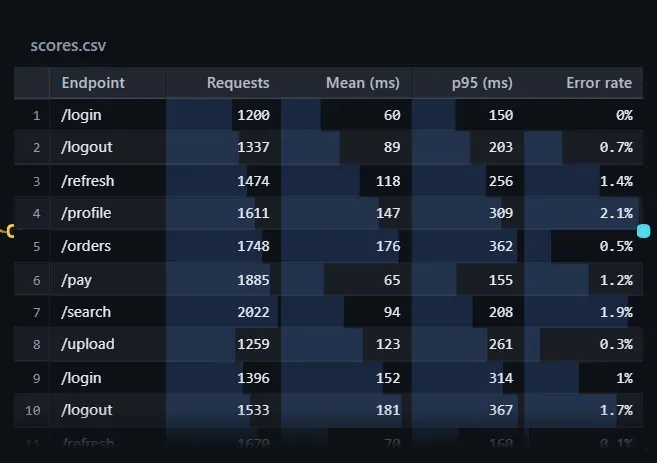
CSV and TSV files are laid out as tables in the card, with a fixed header and row numbers, and number columns right-aligned.
Settings
Section titled “Settings”Adjust them in Canvas display settings:
| Option | Description |
|---|---|
| Position | View the start or the end; on auto, the last rows are shown while the step writing it is running, otherwise it starts from the top. |
| Columns | Hide or show a column; this only affects the card, and the viewer still shows everything. |
| Bars in number columns | A faint bar sized by value under each number cell, so values can be compared without reading them. |
| Sort | Choose a column to sort by, or File order; in interact mode, click a header to sort, and again to reverse. |
Sorting only covers the rows already read. With Have the model fit the card on, the step writing the table keeps the headers short and appends new rows at the end.
Viewer
Section titled “Viewer”The viewer’s title row states the number of rows and columns, and you can switch between Table and Source.
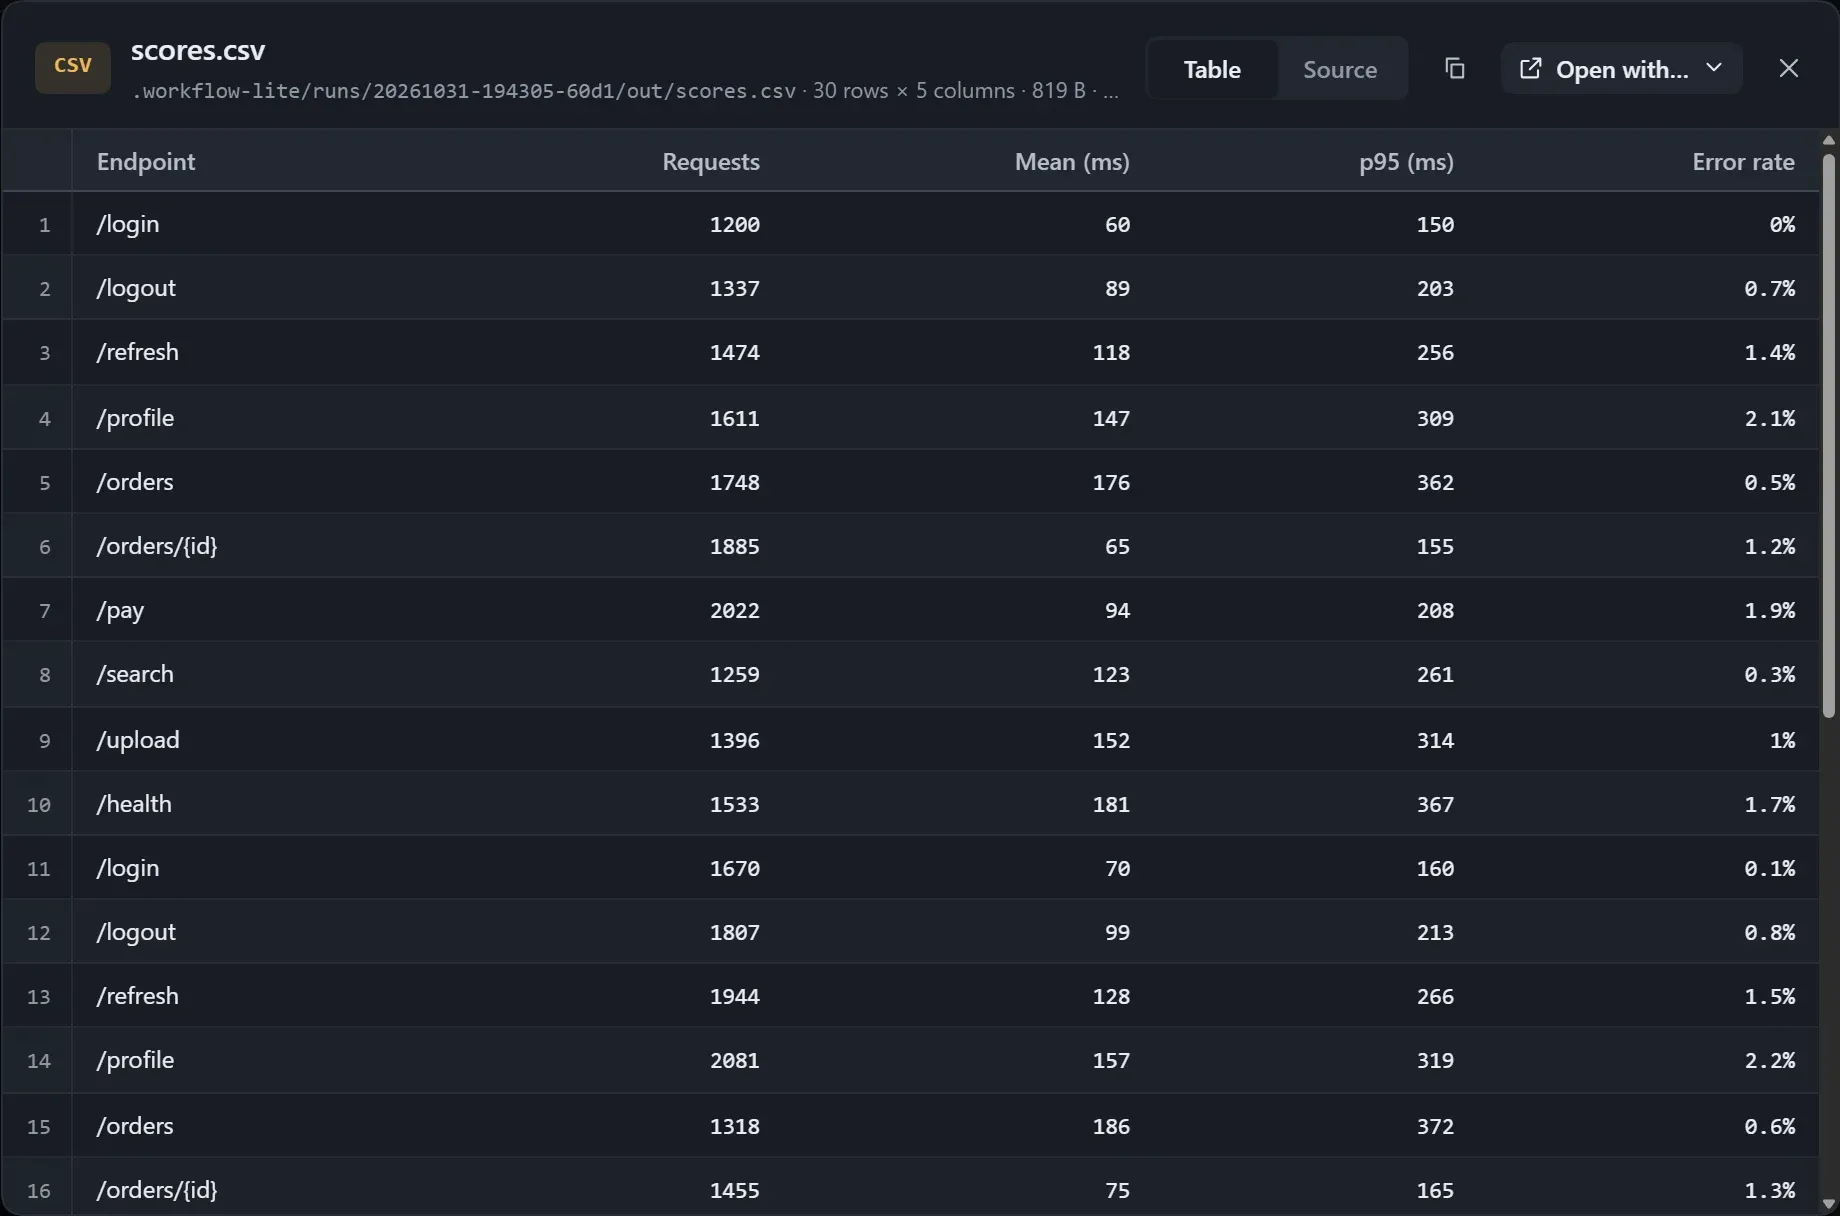
When the table does not fit, it says “N more rows not shown”; switch to Source to see everything.