Web pages and dashboards
An HTML dashboard sits right on the canvas, follows the canvas colors, and refreshes with every round.
Have a step write its result as an HTML file, and the canvas gains a dashboard that refreshes with the run: the current round, the conclusion and the metrics at a glance.
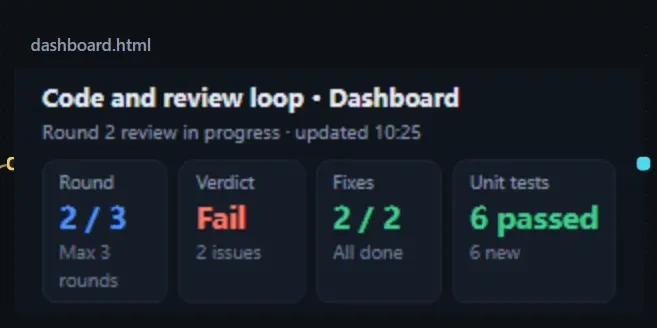
- Have a step produce an HTML file such as
dashboard.html, overwriting the same file every round. - Create a resource card for that file (drag from the step to an empty spot and choose Output file), and turn on Show on the canvas.
- M usually fits, with zoom left at 100%; lowering the zoom shrinks all the text on the page, so open the viewer for what does not fit.
For the full setup, see Check each round’s output on a dashboard.
How it is displayed
Section titled “How it is displayed”- A web page is laid out at “width × height” and then scaled down as a whole; the card’s size is “size × zoom”.
- The dashboard follows the canvas color theme, so it blends into the canvas; the look can be card, soft cut-out, cut-out or frosted glass.
- The card shows one screen as a summary; open the viewer, or open it in a browser with another program, to see everything.
- With Have the model fit the card on, the step that writes the dashboard knows the card size and lays the page out to the card’s width, filling one screen.
Viewer
Section titled “Viewer”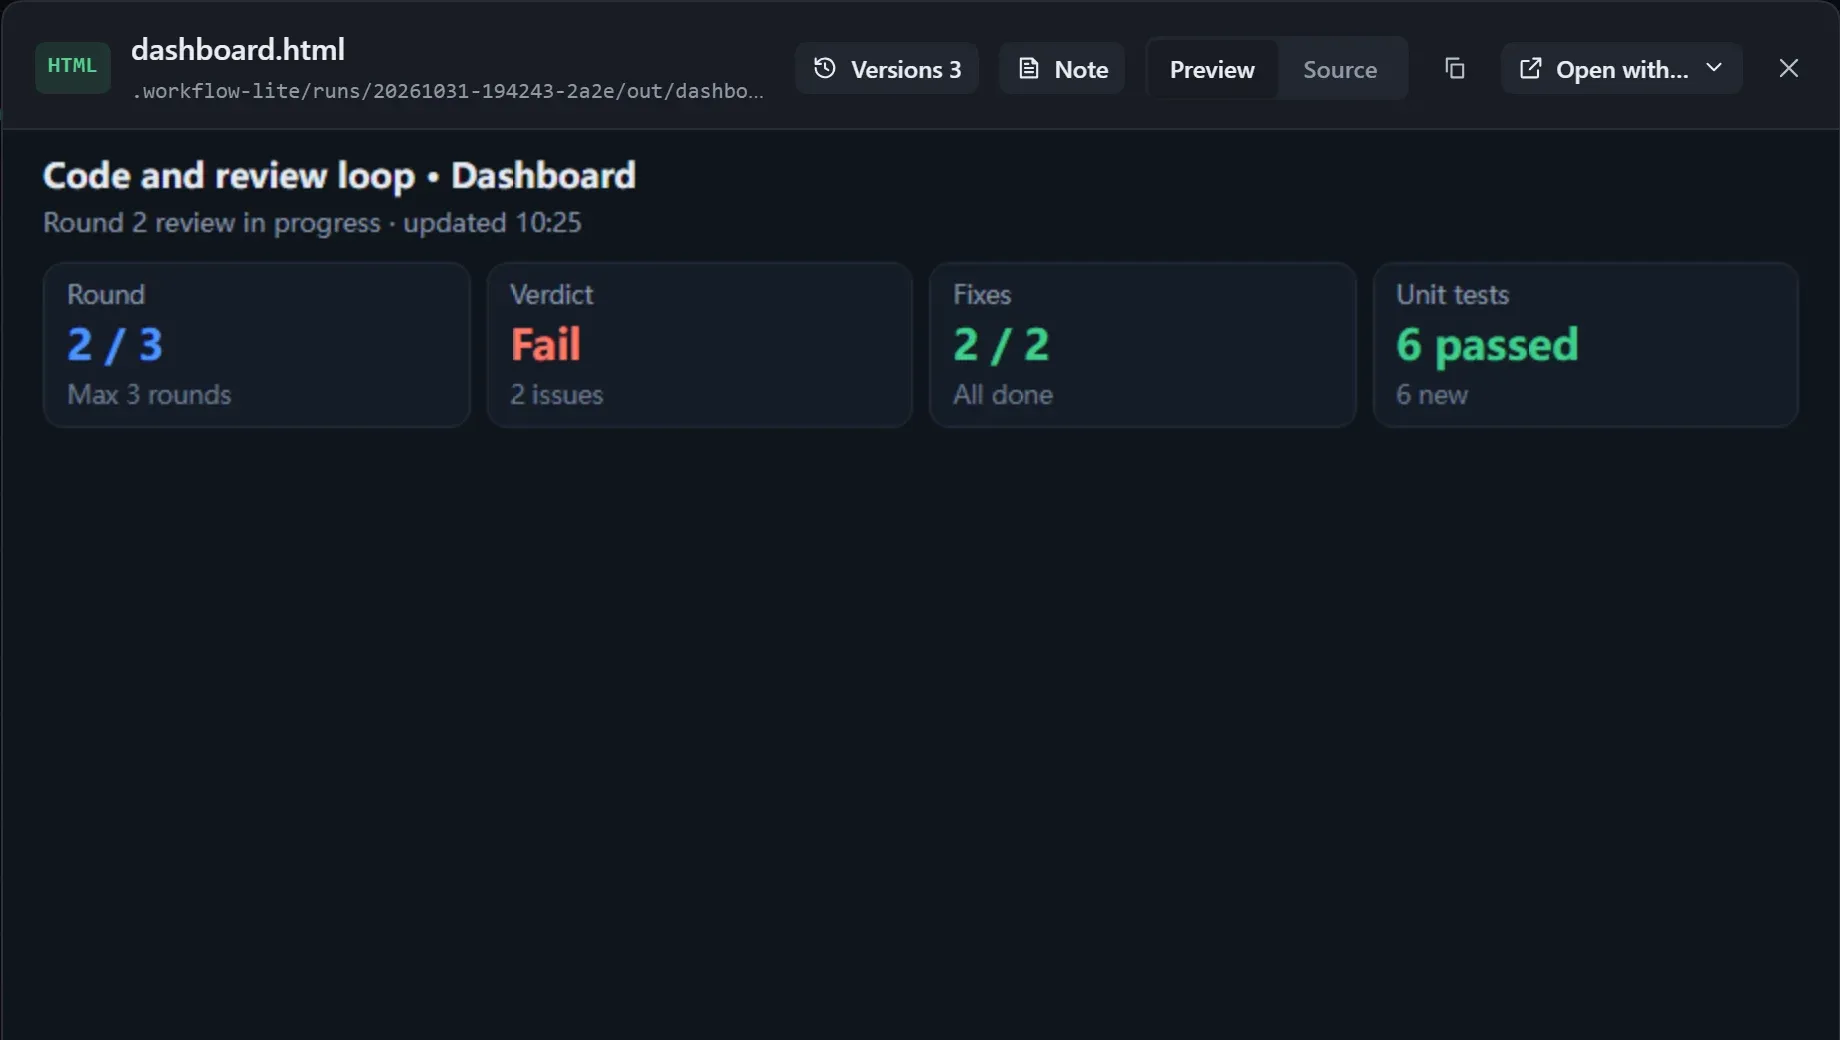
- Images and styles referenced by relative path in the page cannot be shown for now; the viewer’s title row tells you how many could not be shown. For the full effect, click Open with….
- After you click Interact, you can click inside the page; press Esc to leave.
- A version of the dashboard is saved every round and can be compared later; see Reviewing each round’s output.